| 日本語 |


©Tanimoto, H. et al., 2025. This article, including its 10 figures, is licensed under a Creative Commons Attribution 4.0 International License. Originally published in Progress in Earth and Planetary Science (https://doi.org/10.1186/s40645-025-00684-9 *External link)
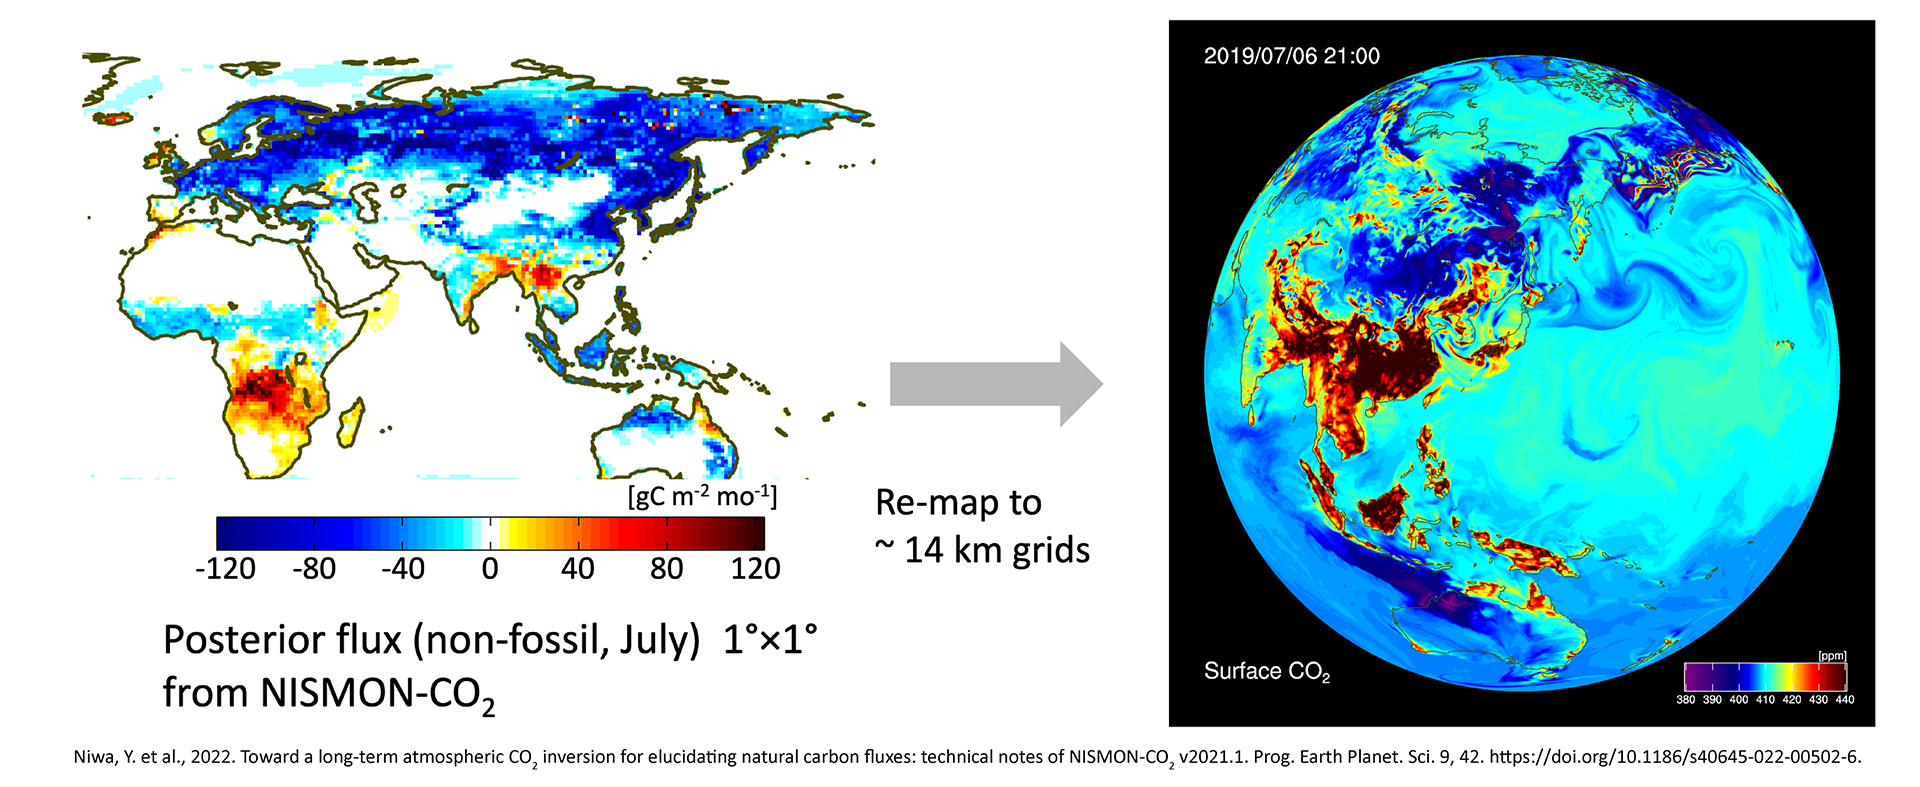
A global inverse analytical system for CO2 and CH4, designated as the NICAM-based Inverse Simulation for Monitoring CO2 and CH4 (NISMON-CO2/CH4: Niwa et al., 2022), has been developed to provide a comprehensive long-term analysis of global fluxes. This system uses ground-based in situ and flask sampling observations for CO2 (Niwa, 2020) and CH4 (Saunois et al., 2020). Currently, the NISMON-CO2/CH4 system is being used to generate the GOSAT-2 L4 product, which includes surface CO2 and CH4 flux estimates and concentrations. NISMON employs the four-dimensional variational method (Niwa et al., 2017a, b), allowing for an unrestricted number of observations in the inversion. This capability is considered to be particularly advantageous, as it can leverage the large number of datasets obtained from the GOSAT-GW XCO2 and XCH4 observations. Consequently, this system is expected to provide valuable insights into the dynamics and mechanisms of governing CO2 and CH4 fluxes on a global scale.
Furthermore, the inversion fluxes derived from the NISMON-CO2/CH4 model/system will be used in regional or local scale flux estimations through high-resolution simulations performed using the NICAM-based Transport Model (NICAM-TM: Niwa et al., 2011). These inversion fluxes will be downscaled to a much finer resolution grid of ~14 km. At this scale, NICAM-TM is capable of simulating fine-scale atmospheric variations in CO2 and CH4 (see Figure 10). These detailed, 3-dimensional data, which are consistent with global observations, will serve as accurate boundary conditions or background fields for studies estimating regional or local scale fluxes, and for detecting anthropogenic emissions.
One of the challenges associated with the GOSAT-GW satellite observations lies in the ability to more accurately quantify anthropogenic emissions of CO2 and NO2, both of which are commonly emitted from fossil fuel combustion sources. Due to the large background concentrations of CO2, primarily from land-biosphere uptake, detecting variations in XCO2 can be difficult. Conversely, NO2 has a considerably higher spatiotemporal contrast due to its short atmospheric lifetime and concentration enhancement near the ground surface where NOx emissions occur. In fact, Kuhlmann et al. (2019) reported that a noise level of only 1 ppm (0.24%) in CO2 measurements makes plume identification difficult, whereas even 20% noise in for NO2 measurements still allows for detection. In addition, the application of high spatial resolution in modeling and observations can significantly aid in overcoming these challenges.
For simultaneous observations of CO2, CH4 and NO2 with GOSAT-GW, model simulations are conducted to match the spatial resolution of the satellite’s data footprint. We are currently developing a suitable modelling framework that integrates the global modelling system, MIROC-ACTM/Chem (horizontal resolution: T42 spectral truncation; vertical levels: 67 (hybrid); altitude: about 0–90 km), with the Weather Research and Forecasting model (WRF)-GHG/Chem (horizontal resolution: 1, 3, 9 and 27 km (variable); vertical levels: 41; altitude: about 0–20 km). A variety of emission inventories are being used and evaluated for model performance, using data from surface, aircraft, and satellite observations. At a 1 km spatial resolution, the WRF-GHG model has been effective in simulating marked differences in the observed CO2 levels at surface sites in the TMA region in Japan (Bisht J. et al., CO2 high-resolution simulation using WRF-GHG over the Kanto region, Japan; manuscript in preparation).
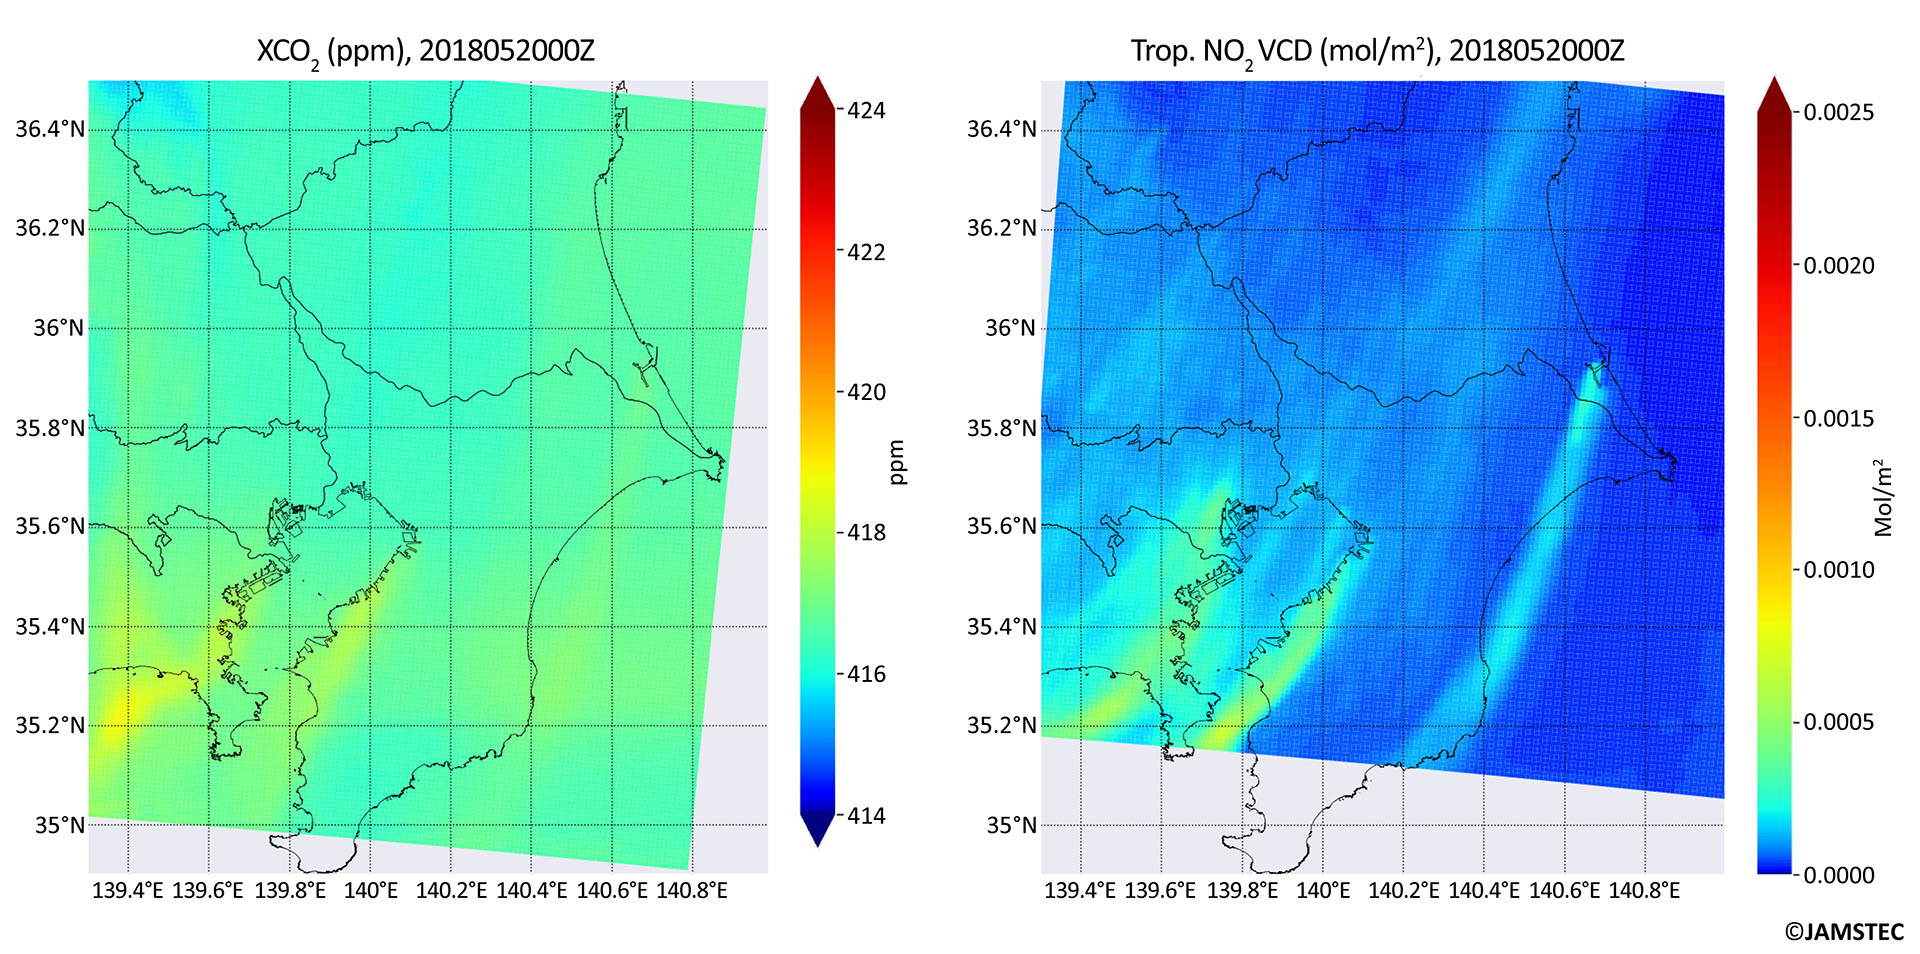
We conducted WRF-GHG/Chem simulations of CO2, CH4 and NO2 at a 1×1 km horizontal resolution focusing on the TMA region. The simulations used the EAGrid (Japan, 1×1 km) (Kannari et al., 2007) as an anthropogenic emission inventory. NO2, which has an atmospheric lifetime on the order of hours and is co-emitted with CO2 when fossil fuels are combusted at high temperatures, and CH4, which is also emitted from densely populated regions with fossil fuel use, were included in the simulations. The resulting models of XCO2 and tropospheric NO2 VCD for the TMA region at this resolution clearly showed plumes from industrial areas around Tokyo Bay and power plants in the northeastern part of the region, particularly the Kashima power plant which emitted approximately 16.6 MtCO2/y (Figure 8). The plumes are more conspicuous in the tropospheric NO2 VCD than in XCO2, although the two plumes originating from Tokyo Bay were also visible in XCO2 images. Given the significant day-to-day covariation of CO2 and NO2 (data not shown), the proxy information from tropospheric NO2 VCD proved extremely useful for pinpointing the location of CO2 fossil fuel combustion and subsequently defining the plume shapes associated with the power plant emissions.
In tropical regions, such as South Asia, including India, modelling XCO2 and detecting point source emissions present more challenges compared to temperate and boreal regions. In these colder regions, terrestrial biospheric activities can be considered dormant during the winter season, which simplifies emission modeling (e.g., Tohjima et al., 2020). In contrast, during the summer monsoon season (June-August) in South Asia, strong CO2 uptakes are estimated, reflecting vigorous biospheric activity (Patra et al., 2011). Additionally, during the winter monsoon season, there is a strong drawdown of CO2 due to intensive agricultural activities (Umezawa et al., 2016).
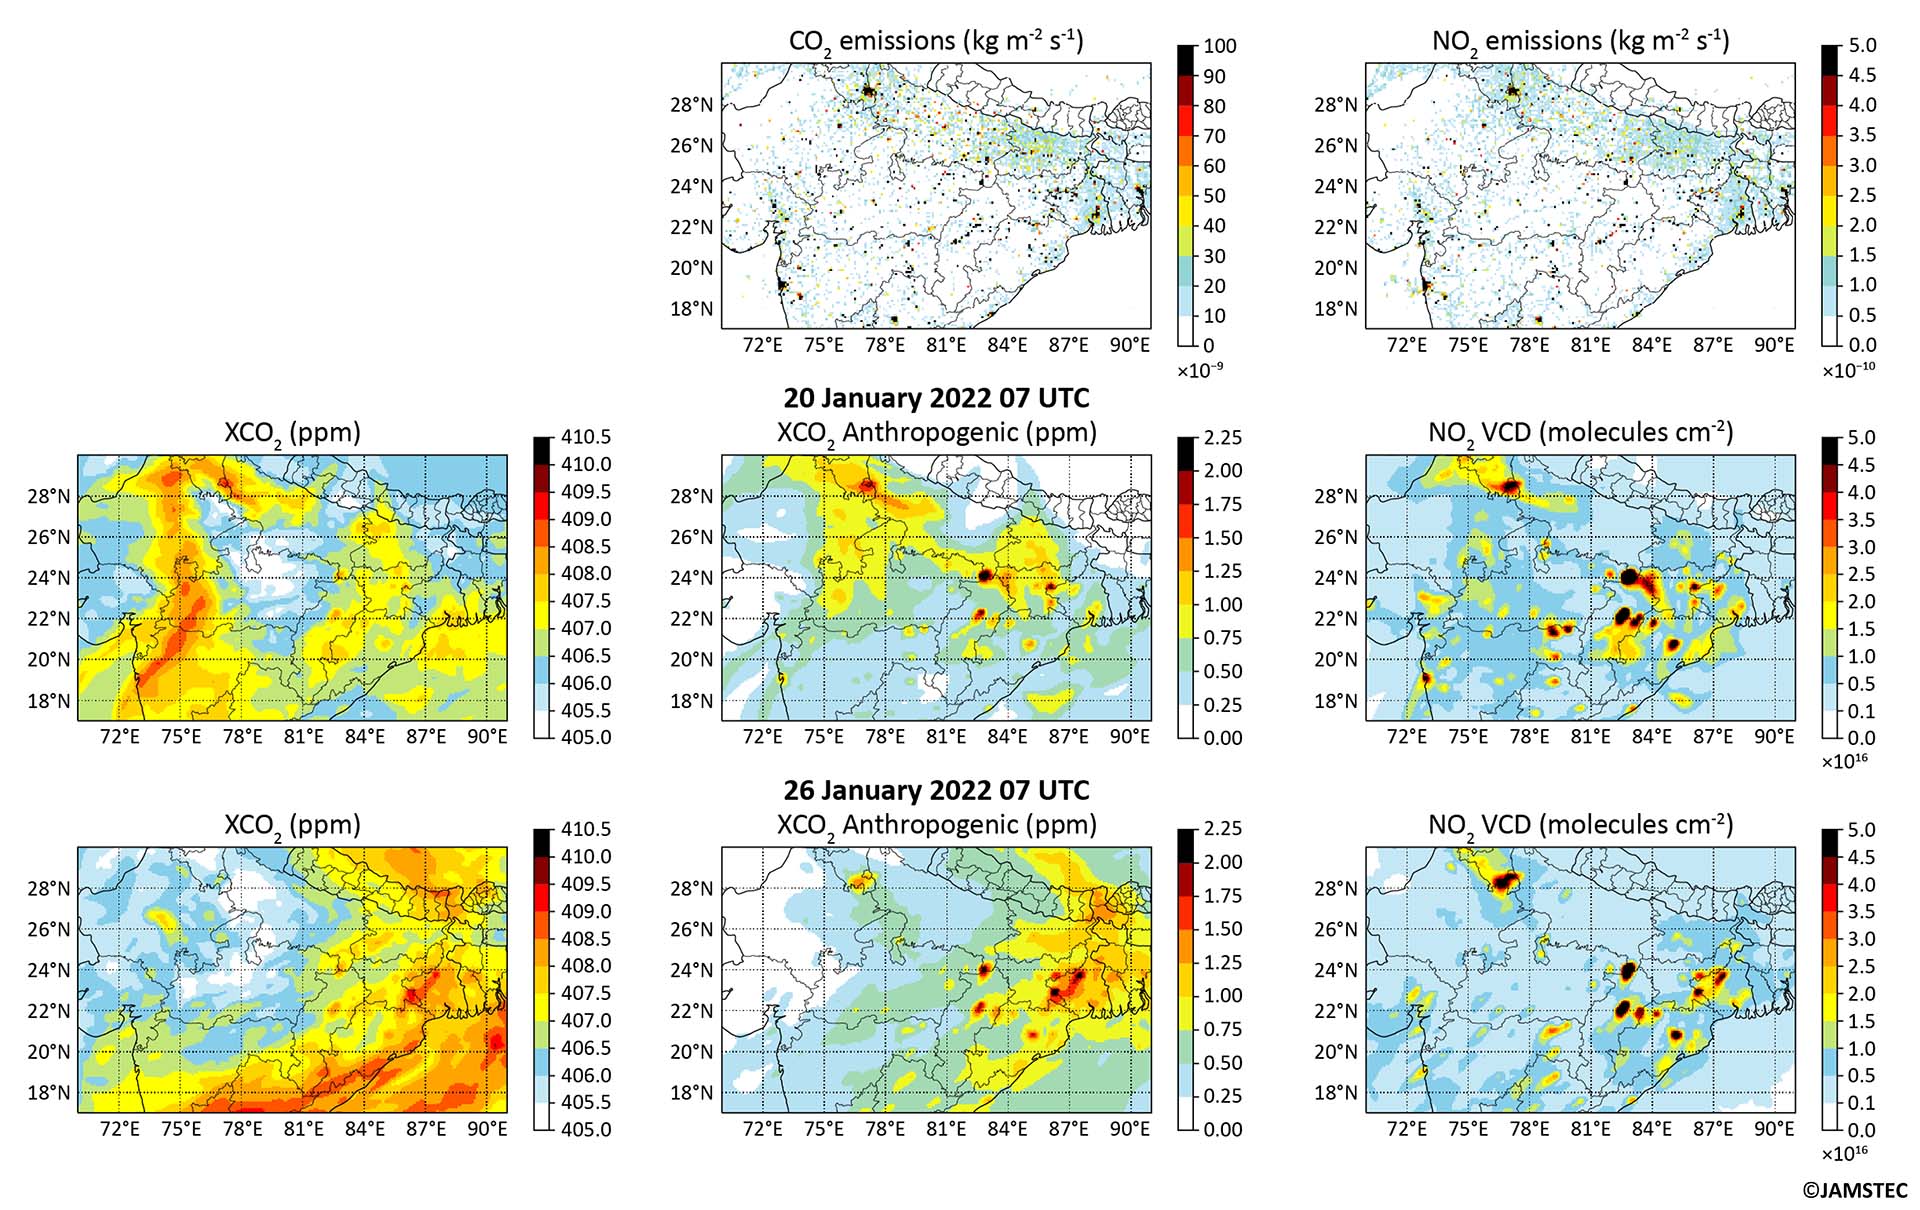
The Weather Research and Forecasting model-Vegetation Photosynthesis and Respiration Model (WRF-VRPM), or GHG-Chem model, was run for South Asia, at a relatively coarser horizontal resolution of 3 km × 3 km to cover the entire northern part of South Asia. As shown in Figure 9, XCO2 has large frontal systems spreading across the South Asia domain, where hotspot emissions are indistinguishable. However, tropospheric NO2 VCD effectively tracked hotspot emissions. When anthropogenic emission signals are isolated and plotted separately from the model data, the hotspot emissions become more discernable and are coincident with the tropospheric NO2 VCD distributions. Due to the absence of significant chemical production or loss of CO2 in the troposphere, elevated CO2 values persist in areas distant from emission hotspots. Consequently, it is highly desirable to have a well-validated VRPM module for high-resolution biospheric flux simulation in the WRF-GHG simulations. The capability of the model to accurately track emission hotspots will largely depend on the retrieval accuracy over tropical regions, which needs to be approximately in the range of 1 ppm.
In order to improve our ability to quantify the CO2 emissions using GOSAT-GW data, there is a need for a new spatially-explicit emission inventory. A fossil fuel CO2 emissions inventory, named the Multiscale Overlap Scheme for Analyzing national Inventory of anthropogenic CO2 (MOSAIC), has been newly developed to facilitate the spatial analysis of socioeconomic activities associated with greenhouse gas emissions from anthropogenic sources across Japan (a representative example for the TMA is shown in Figure 10) (Saito, M. et al., Fossil fuel carbon dioxide emissions across Japan at a resolution of 1 km; manuscript in preparation). The principal objective of MOSAIC is to generate a spatiotemporal distribution within the fossil fuel CO2 emissions inventory by integrating public governmental statistics, such as the Population Census and Economic Census surveys, which form the basis of all official statistics. MOSAIC accounts for the emissions from three source categories––point, line, and area sources––and encompasses eight sectors: electricity generation, civil aviation, waterborne navigation, and waste incineration for point sources; road transportation for line sources; and industrial and commercial, residential, and agricultural machinery use for area sources. Geographic information for individual facilities, categorized as point sources, is specified by governmental statistics. For line and area sources, where specific locations are not available, geographic information is given based on the census tracts of individual sectors. Emissions quantities are calculated by multiplying the sector-specific activity data by emission factors. A key feature of the MOSAIC dataset is that the emissions estimates are made, in principle, by using the activity data that is specific to each facility and census tract, thus eliminating the need for proxy data to allocate country-scale emissions totals to finer-scale areas. This method ensures that emissions are quantified at the level of elementary plots. After constructing monthly sector emissions for individual facilities and census tracts, all emissions data are overlaid on a geographic map. The data are then segmented into cells approximately 1 km in scale.
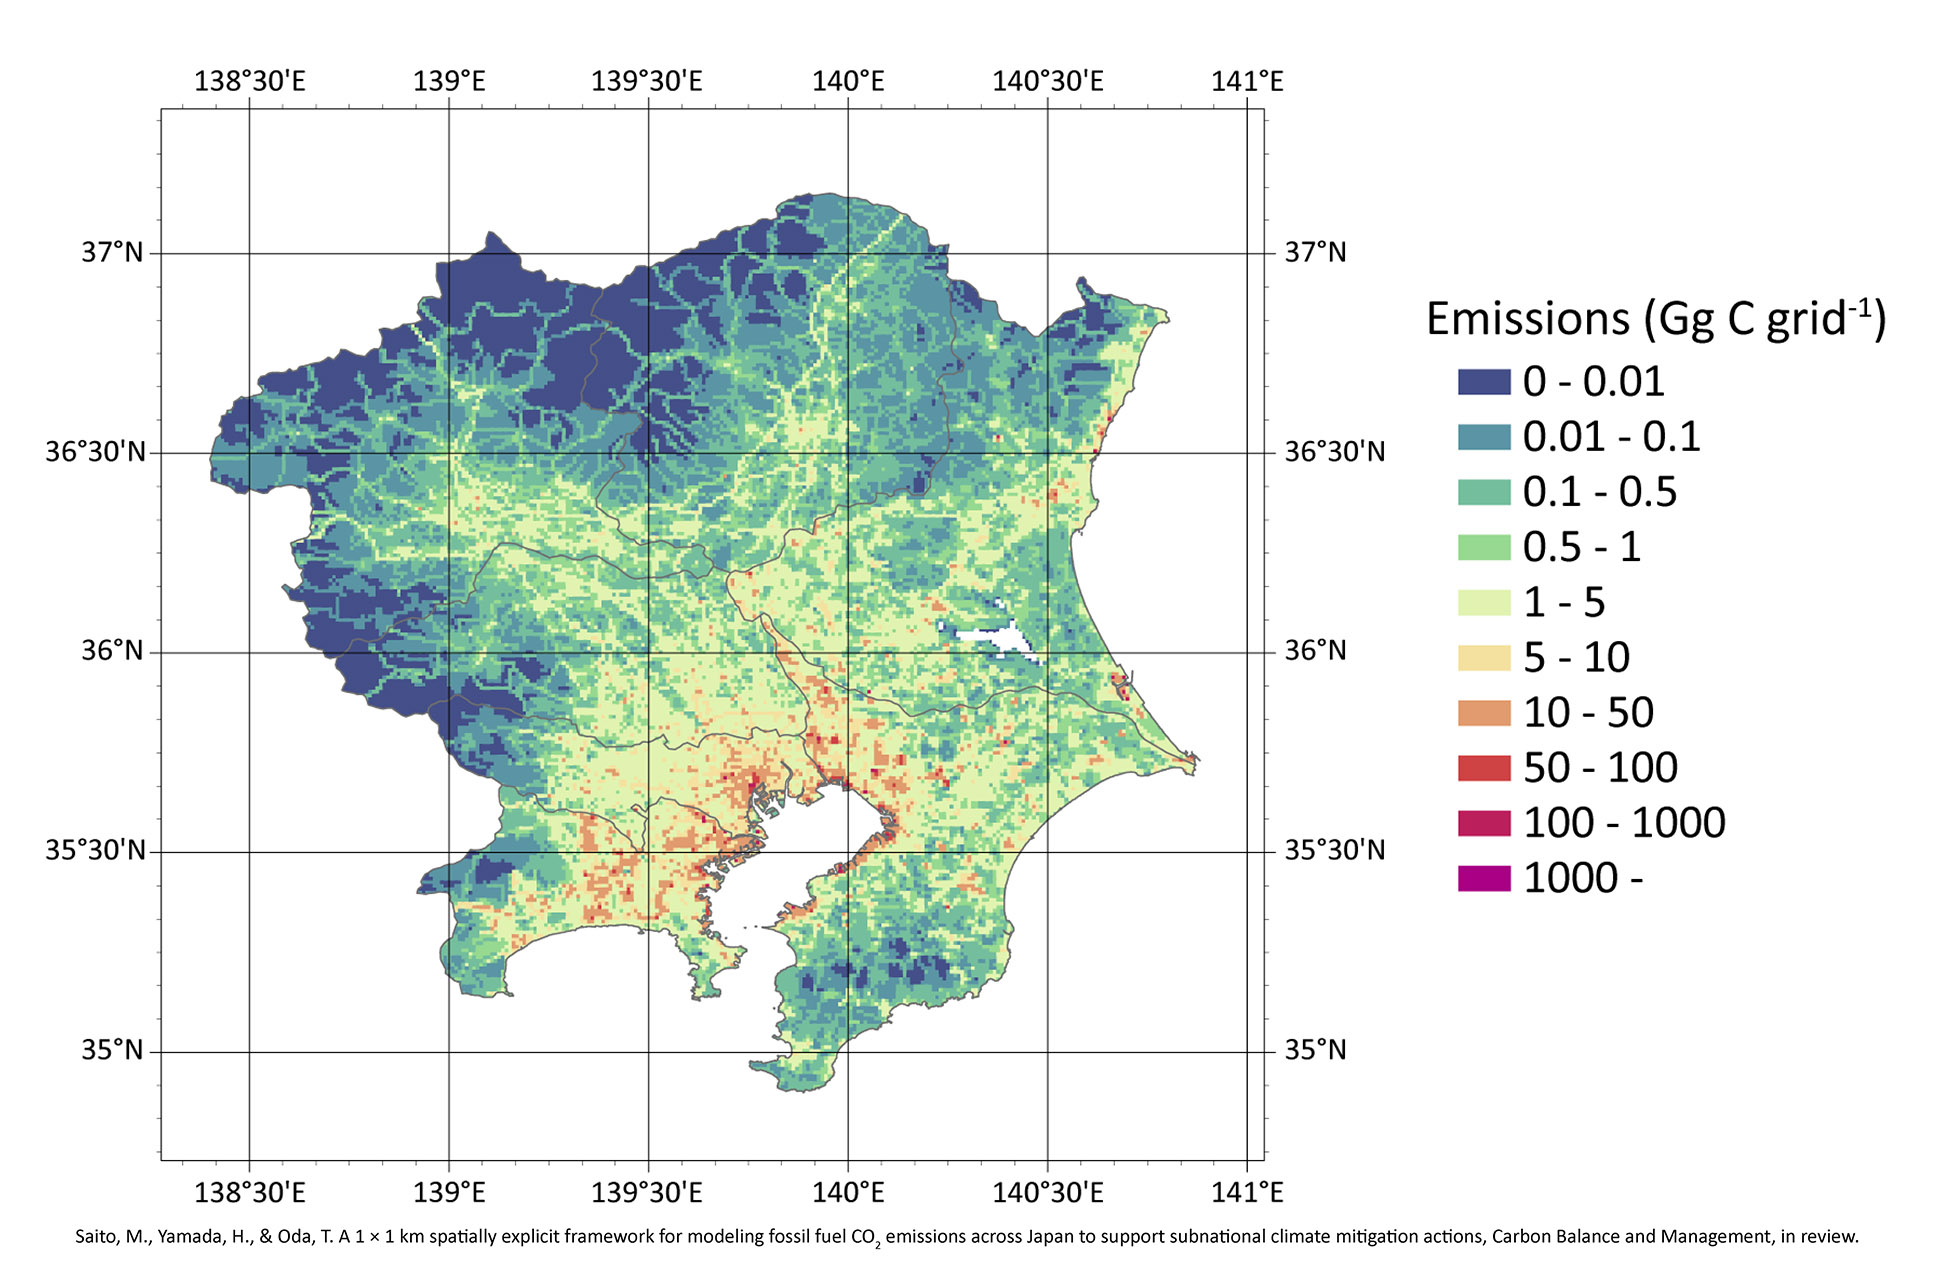
Understanding the spatial distributions and the precise quantities of emissions is crucial, particularly over urban areas, for identifying emission sources/sectors and potential targets for emission mitigation. Due to the limited sampling patterns associated with coarse spatial resolution of the instantaneous field of view and/or the narrow observation swath, it has been difficult to use the XCO2 data from previous satellite missions such as GOSAT, GOME-2 and OCO-2 to examine the emission sources over megacities (e.g., Yokota et al., 2009; Munro et al., 2016; Crisp et al., 2017). However, the improved spatial resolution of the XCO2 and XCH4 datasets from the GOSAT-GW observations will improve our ability to assess the distributions and the amounts of emissions from large cities and significant point sources. In conjunction with the GOSAT-GW observations, the MOSAIC inventory will provide bottom-up information on high-resolution distributions and the structure of fossil fuel CO2 emissions across Japan. This will facilitate the monitoring of emissions from cities and the estimation of emissions using atmospheric inversions.
We conducted an end-to-end test to evaluate the performance of the TANSO-3 sensor, which is currently undergoing assembly and testing. To facilitate this evaluation, the “TANSO-3 simulator” was developed, incorporating optical polarization functions, instrument functions, signal-to-noise ratios, radiance-voltage conversions, and analog-to-digital conversions. These features were integrated in accordance with the specifications of the TANSO-3 sensor prototype design. We utilized the SCIATRAN radiative transfer model/retrieval algorithms software (Rozanov et al., 2002; 2014) to process the three-dimensional atmospheric composition fields and conducted radiative transfer model calculations to generate the L1 products. For the retrieval of NO2, we used the QDOAS software package (https://uv-vis.aeronomie.be/software/QDOAS/). For CO2 and CH4, we performed non-linear least-squares inversions based on forward modeling to produce the L2 products. Subsequently, we evaluated the quality of the L2 CO2, CH4, and NO2 products by comparing them to the input parameters.
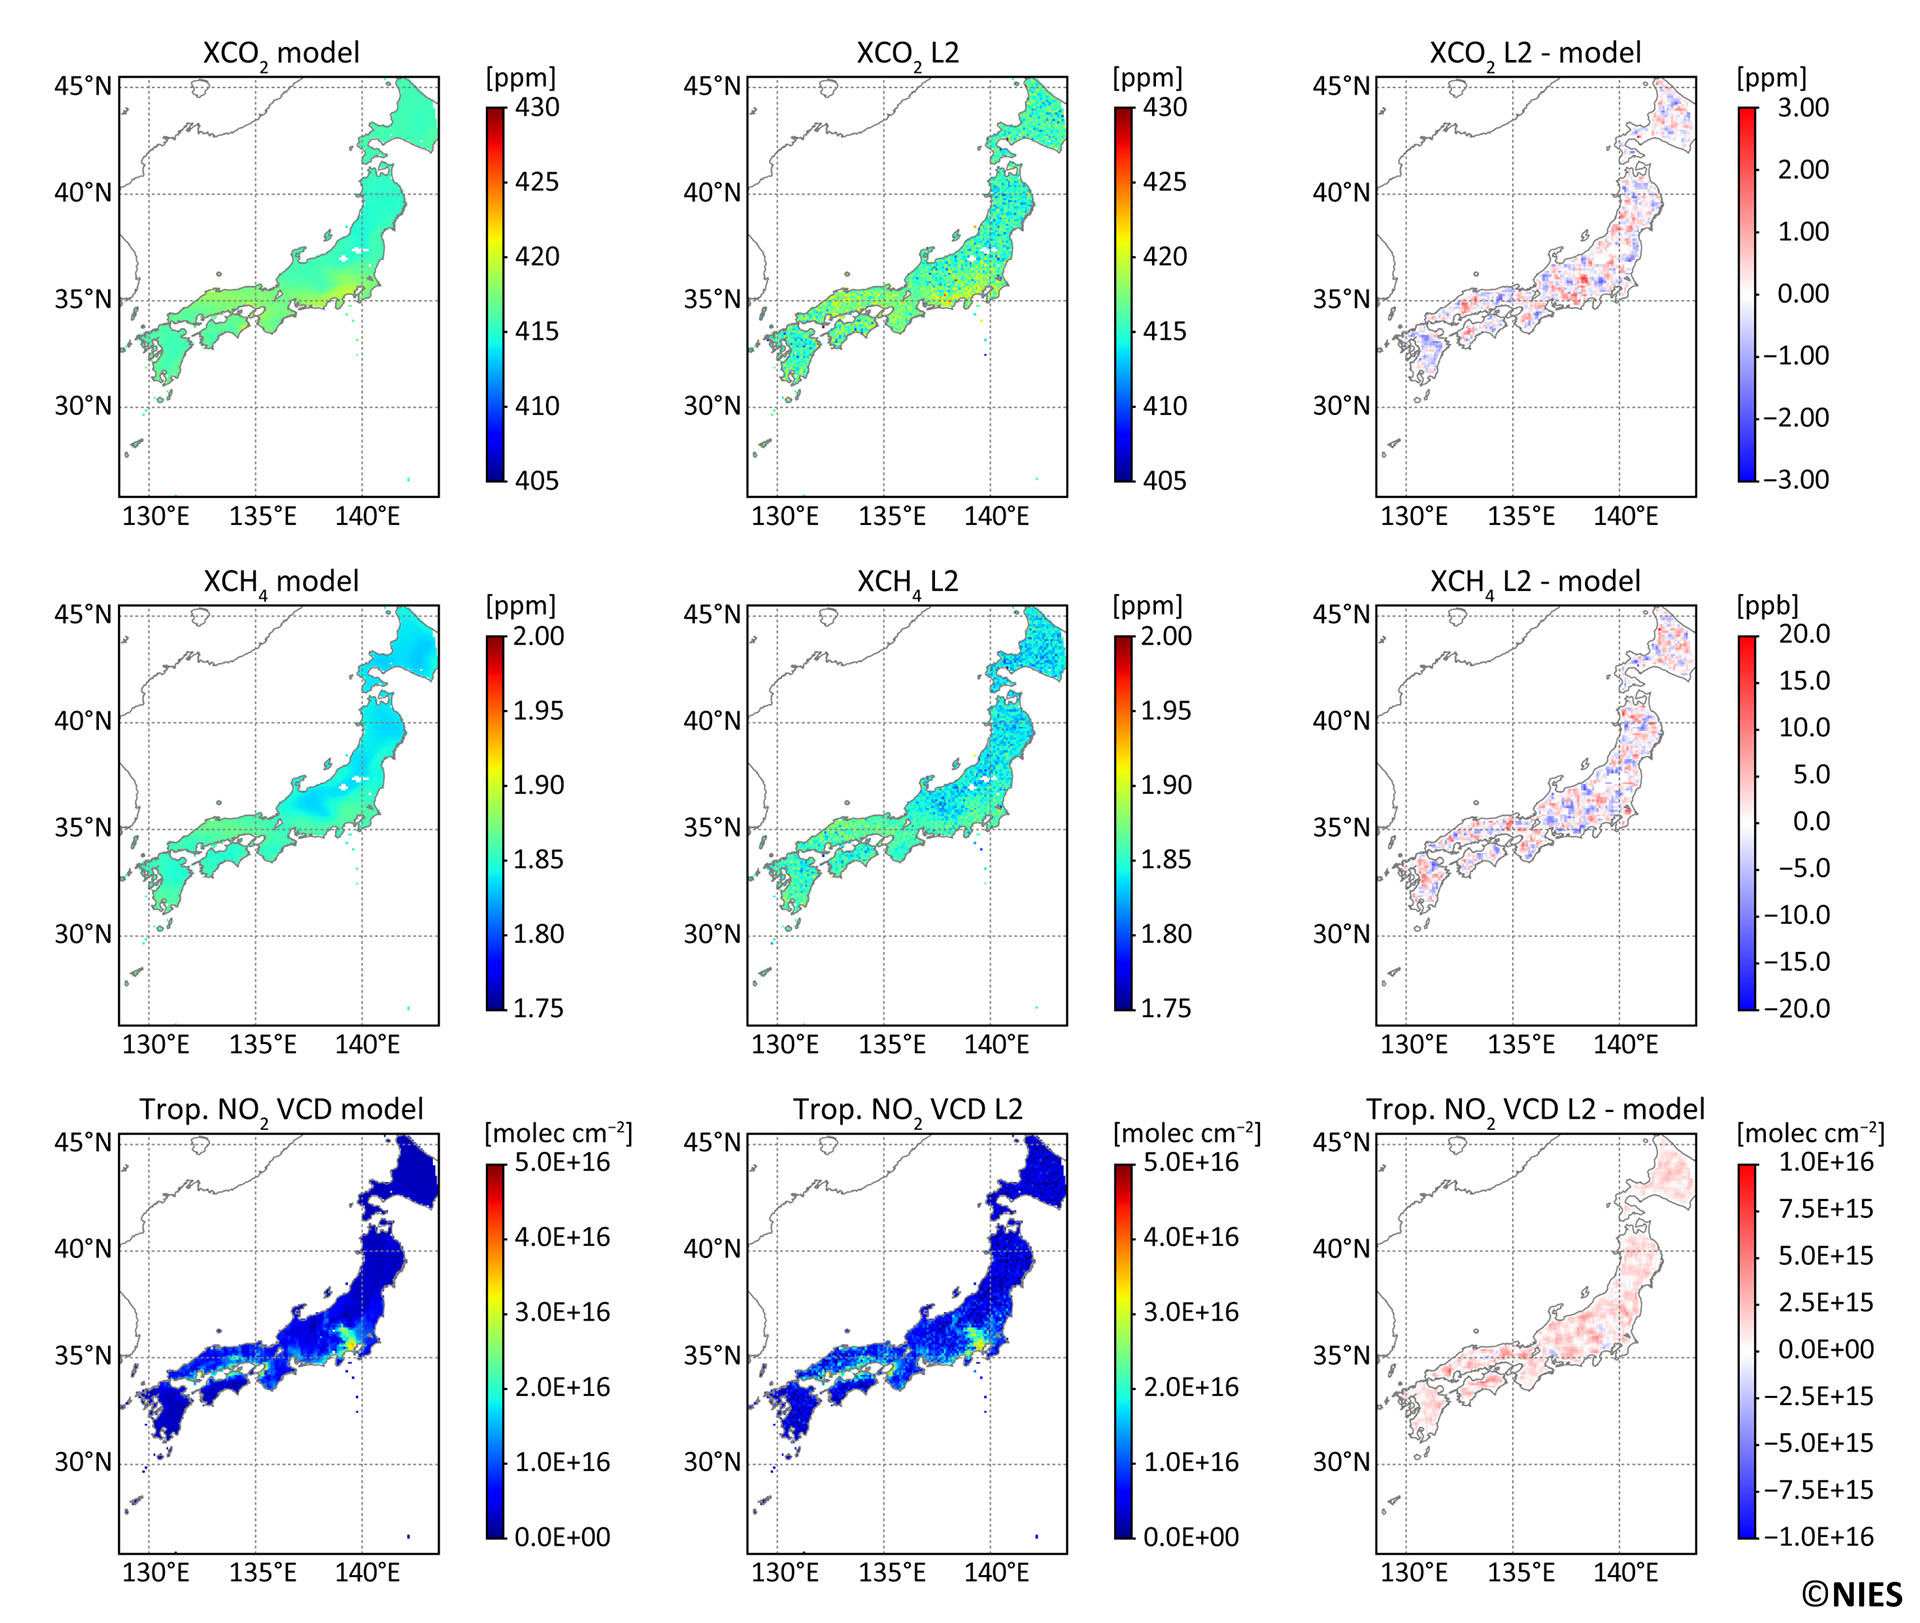
Figure 11 shows the simulated L2 retrieval results for XCO2, XCH4 and NO2 VCD over Japan at a spatial resolution 10 km × 10 km, to be observed using Wide Mode. Also shown are the differences between the retrieved L2 results and the input “model” values, which have been smoothed over a 30 km × 30 km area using a 3 × 3 pixel grid. Generally, the simulated retrievals effectively capture the nationwide scale distribution patterns for these trace gases, including regional gradients and hotspots around urban areas, with residuals remaining within a reasonable range compared to the “model” values. The results over Tokyo, shown at the same 10 km × 10 km resolution, indicate some random noise across all species. Nonetheless, the retrievals successfully capture the gradients in the concentrations of XCO2, XCH4, and NO2 VCD over Tokyo (Figure 12).
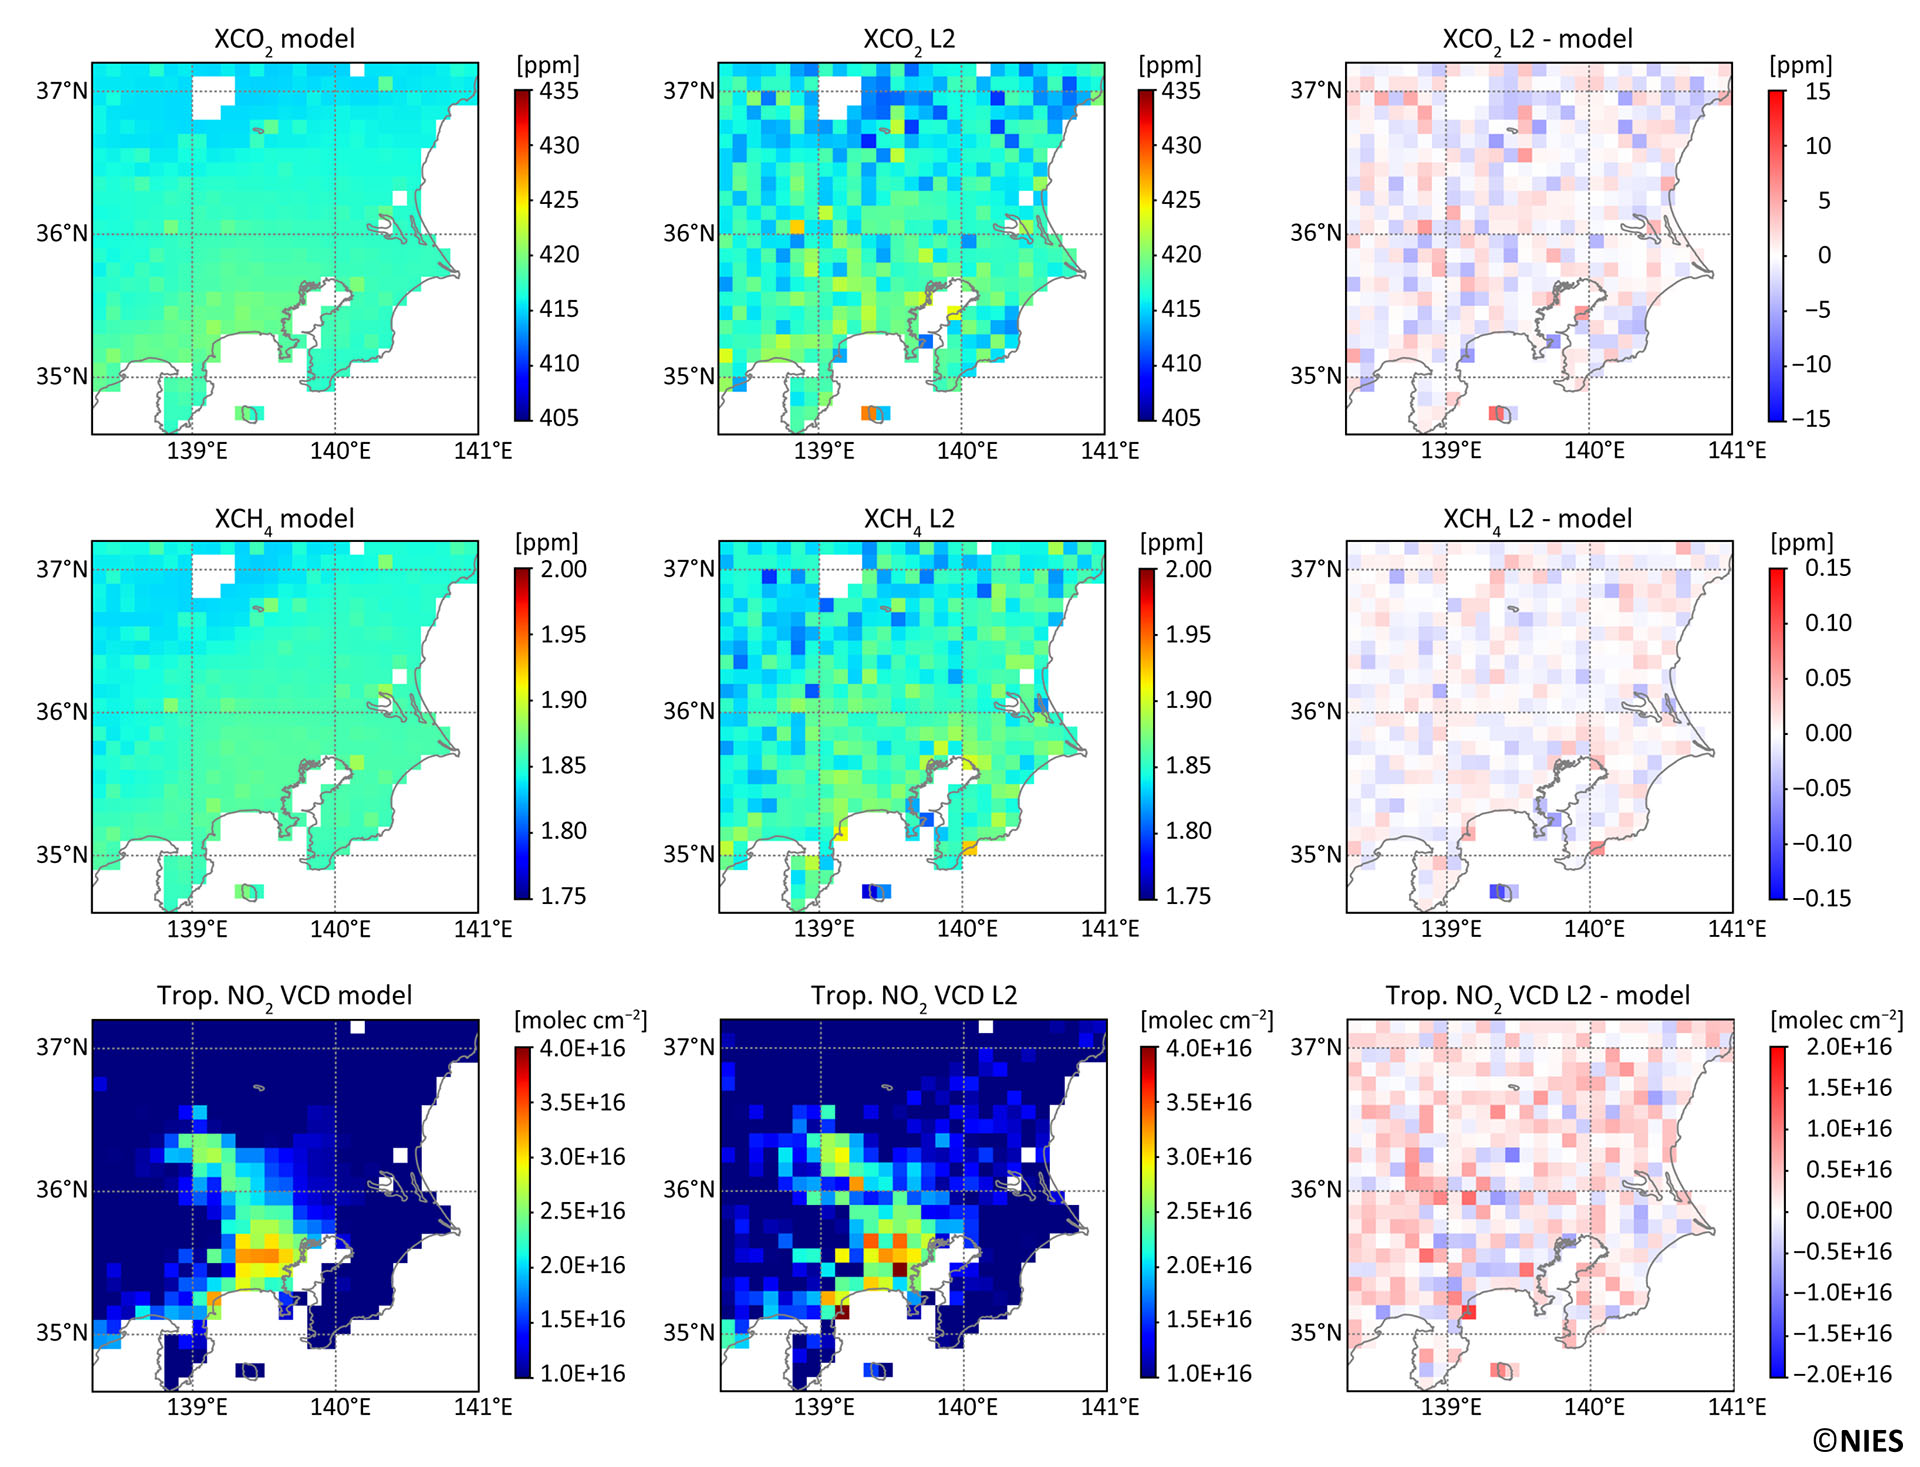
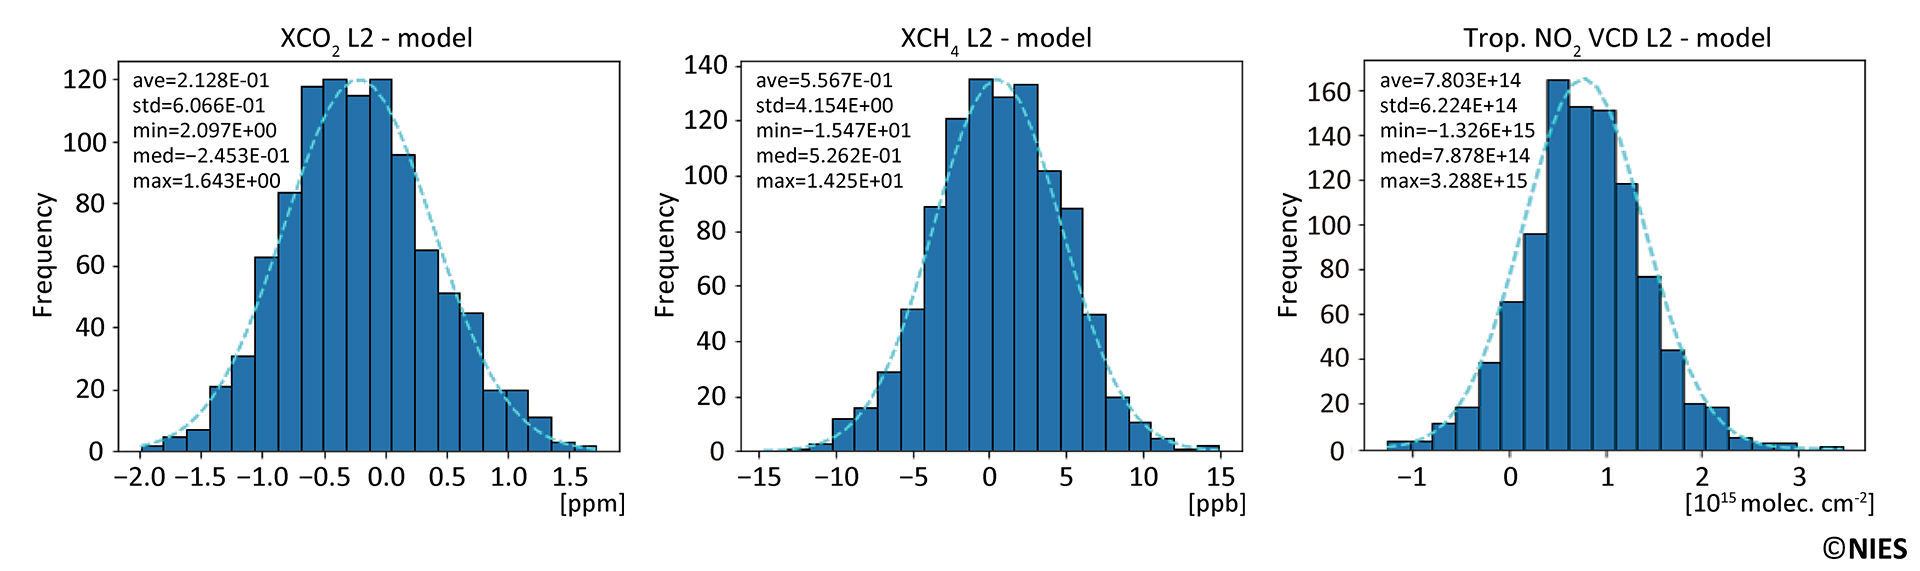
Figure 13 shows the distributions of the simulated L2 deviations against the input “model” data over the TMA for Wide Mode. The standard deviations are 0.6 ppm, 4.2 ppb and 6.2 × 10¹⁴ molecules cm-2 for XCO2, XCH4 and NO2 VCD, respectively. Although these results are within the precision required to meet the Mission Requirements, since the simulated L2 retrievals do not account for “real” observation conditions, further analysis is necessary to incorporate factors such as clouds, aerosols, solar zenith angles, and surface albedos.
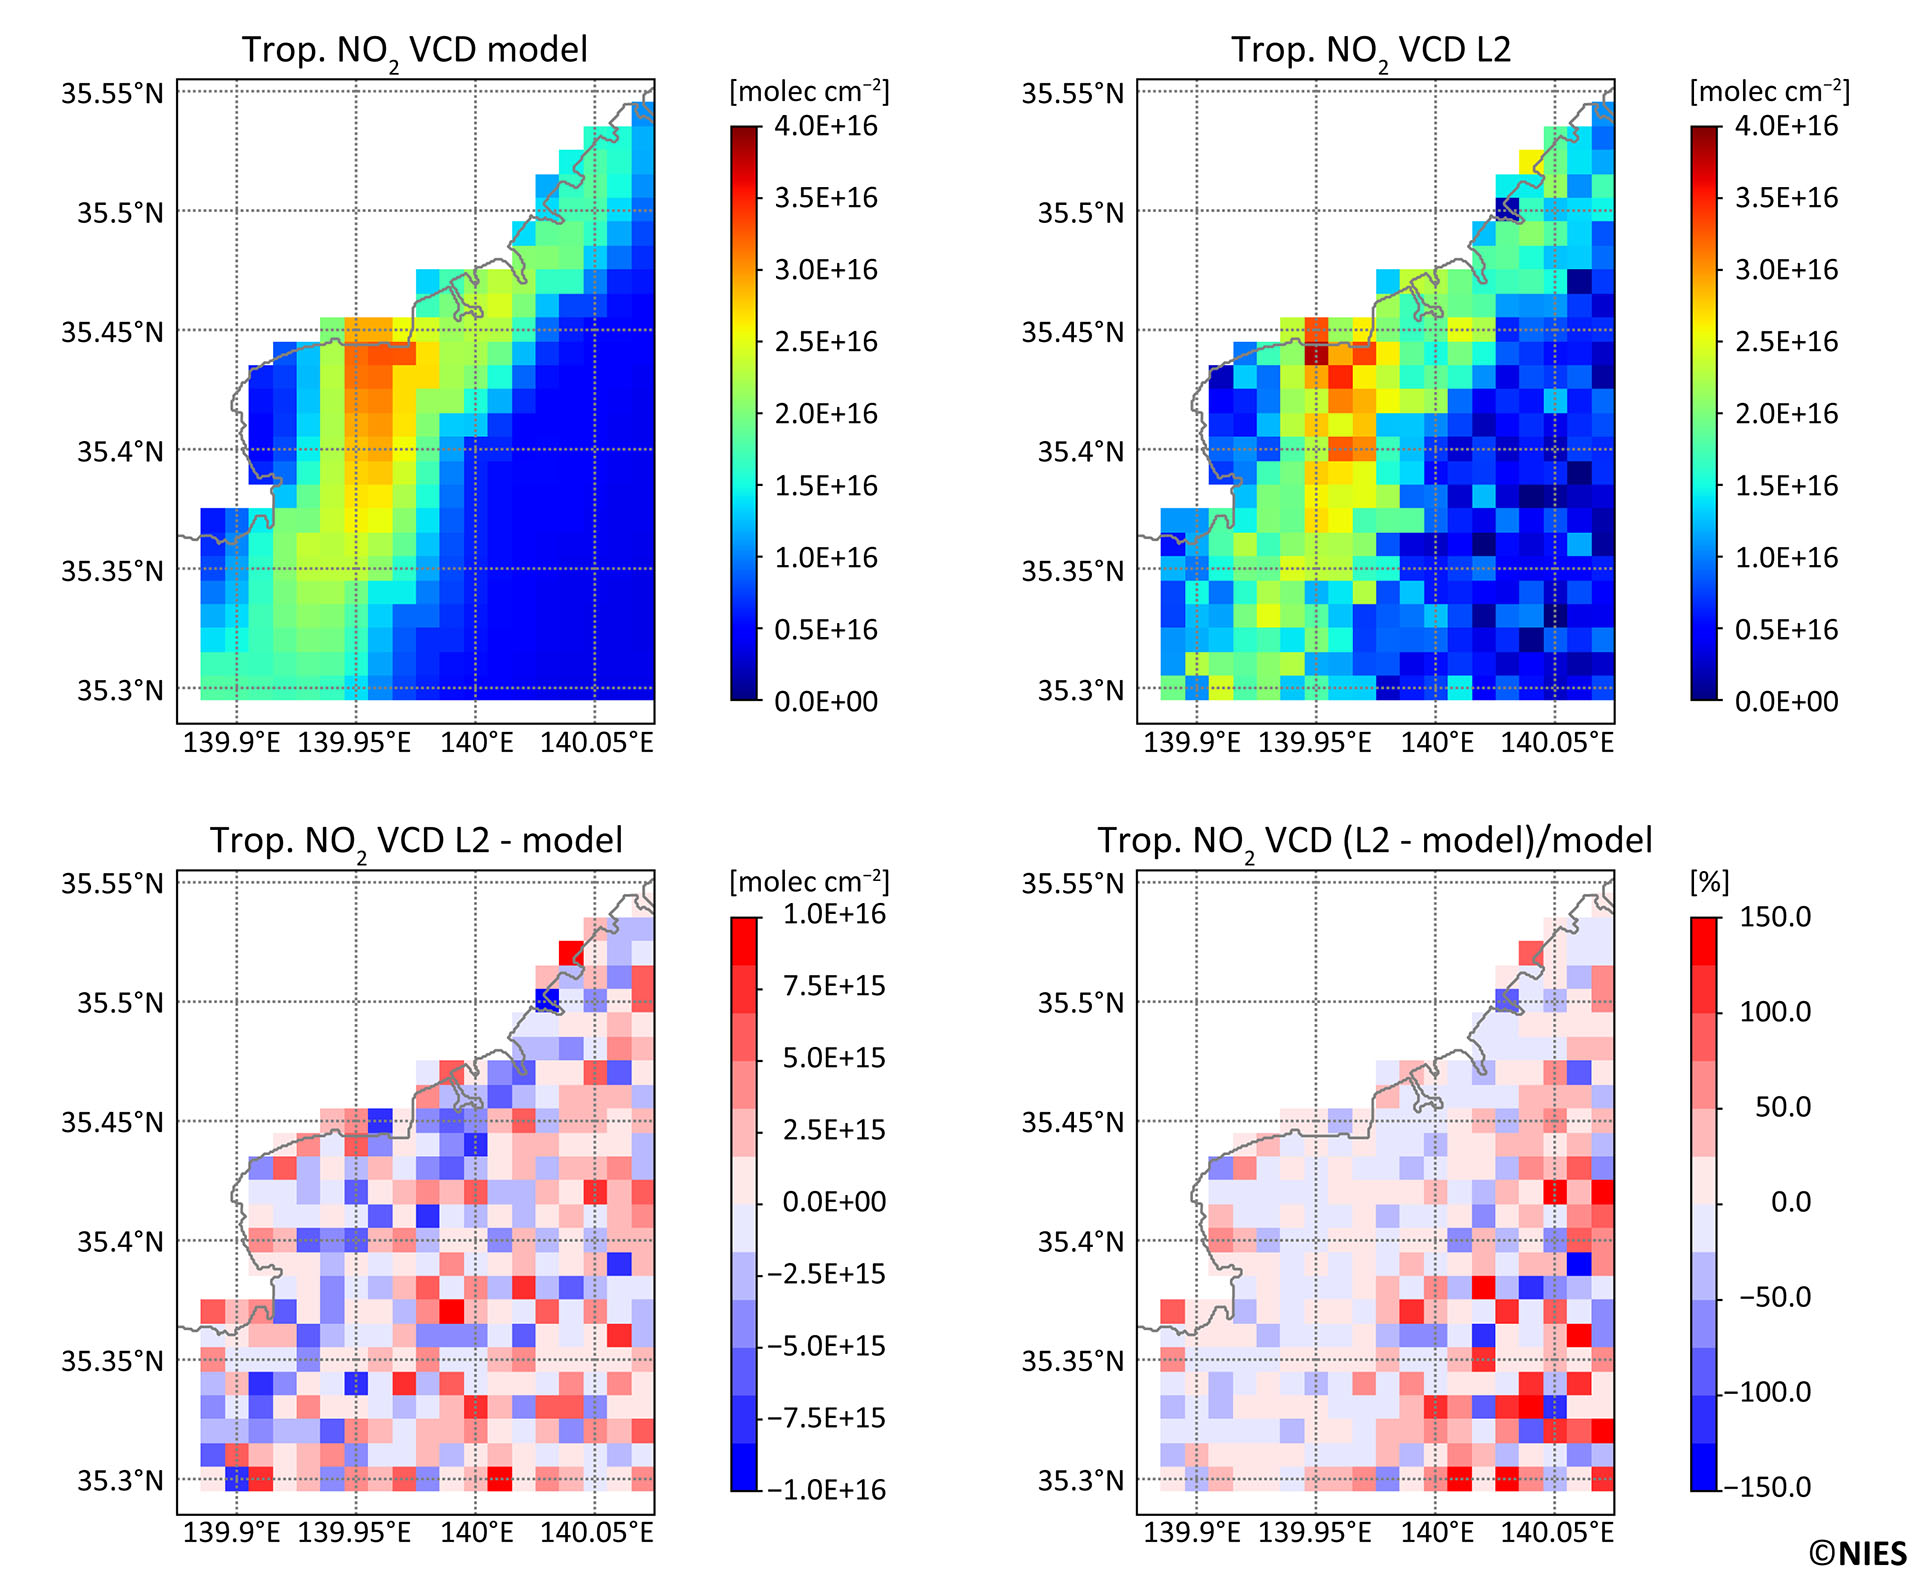
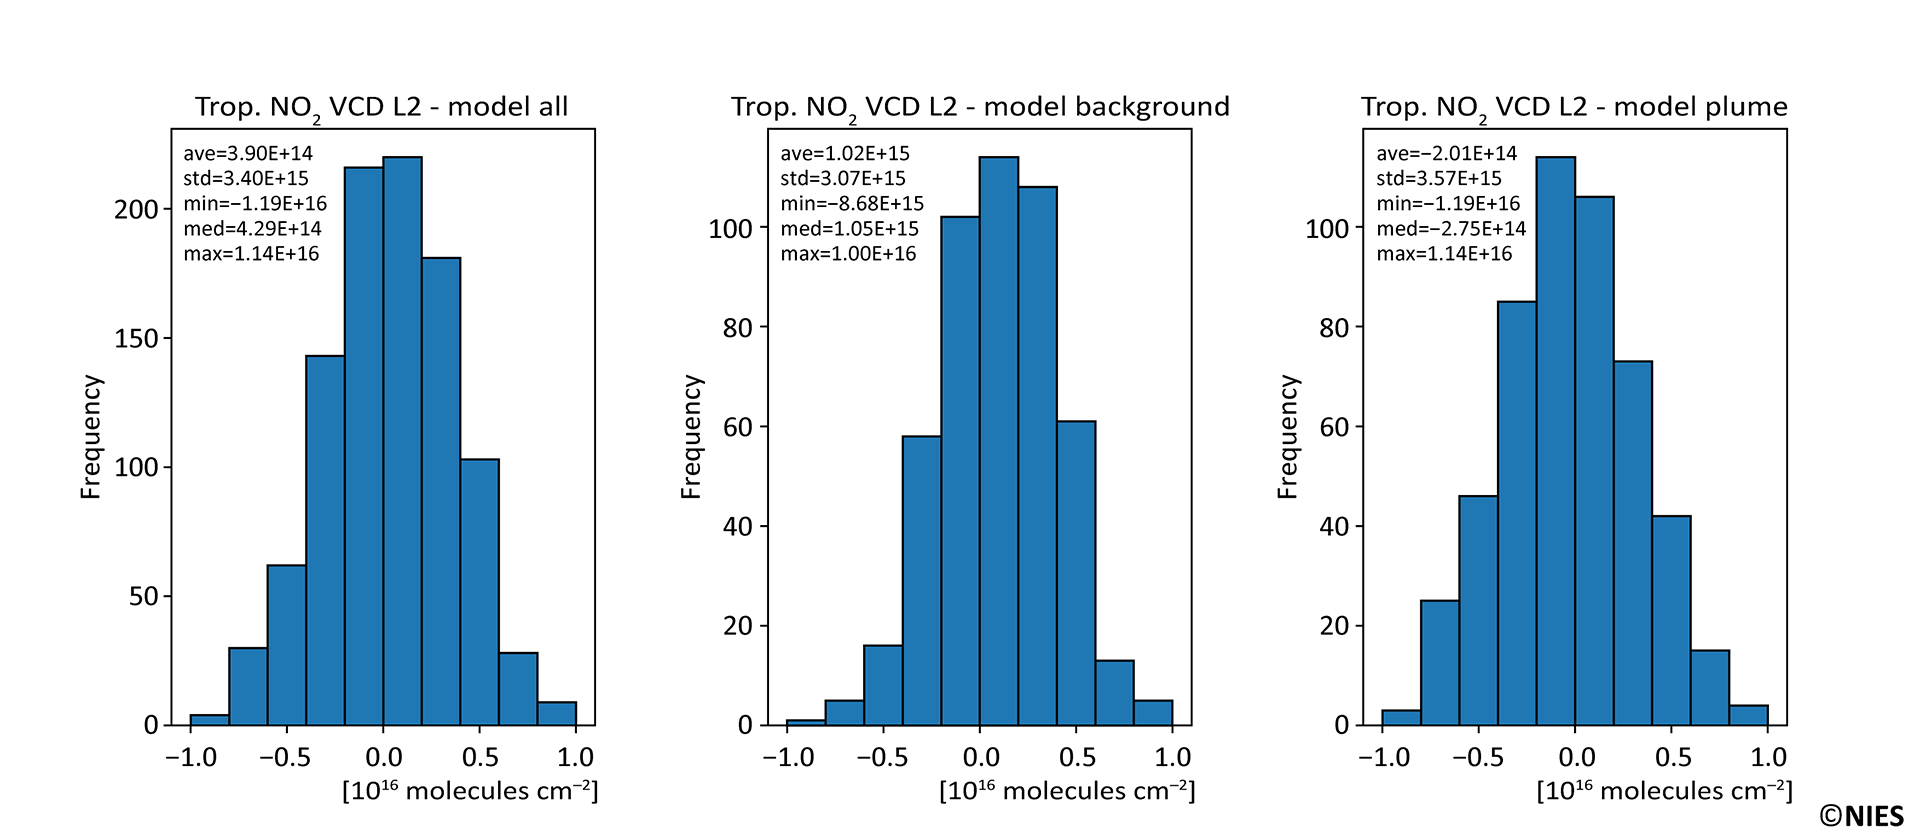
The detection of NO2 from large point sources in Focus Mode with a 1 km × 1 km resolution was also evaluated (Figure 14). The maximum NO2 VCD for this power plant was 4.0 × 10¹⁶ molecules cm-2, as determined by the chemistry-transport model simulation. Although the simulated retrievals exhibit random noise over the region, they effectively capture the local gradients, source location, and plume shape. The distributions of the simulated L2 deviations from the input “model” data show that the standard deviations are 3.1 and 3.6 × 10¹⁵ molecules cm-2 for NO2 VCD in the background and plume, respectively (Figure 15).
In recent years, substantial progress has been made in the implementing the Paris Agreement. The inaugural Global Stocktake, which was undertaken to assess the implementation status of GHG reduction efforts reported by countries around the world, was conducted in 2023. Subsequent Stocktakes are scheduled for 2028 and will continue on a five-year cycle. This process requires the verification of country-level emissions through highly accurate and transparent methods. Following the latest Global Stocktake, each country is expected to review its Nationally Determined Contribution (NDC) in 2025 and 2030. To set appropriate and ambitious targets, it is necessary to accurately assess the current status of emissions and to minimize uncertainties in future projections.
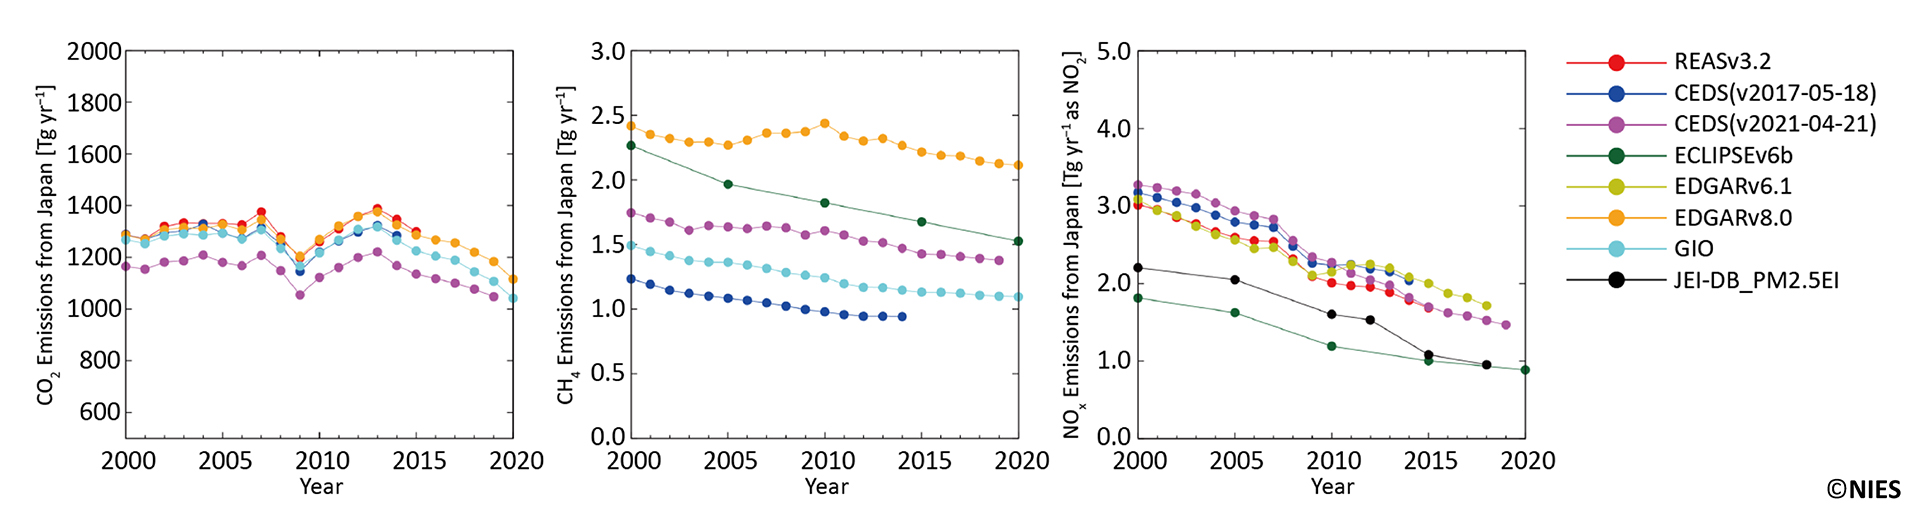
Bottom-up emission inventories, which account for all climate-relevant species emitted from the Earth’s surface, are associated with substantial uncertainties. While these inventories generally provide accurate estimates of GHG emissions from fossil fuel use, but can exhibit large uncertainties in other sectors. Figure 19 compares Japan’s national total emissions of CO2, CH4 and NOx, derived from various emission inventories, alongside their long-term trends from 2000 to 2020. The estimates from seven research-based emission inventories are presented: REAS (Regional Emission inventory in ASia) v3.2 (Kurokawa and Ohara, 2020), CEDSv2017-05-18 (Hoesly et al., 2018), CEDS (Community Emissions Data System) v2021-04-21 (O’Rourke et al. 2021), ECLIPSE (Evaluating of the Climate and Air Quality Impacts of Short-Lived Pollutants) version 6b (IIASA, 2019; Klimont et al., 2017), EDGAR (Emissions Database for Global Atmospheric Research) v6.1 (Monforti-Ferrario et al., 2022), EDGARv8.0 (Branco et al., 2023), and JEI-DB_PM2.5EI (Japan Emission Inventory Database, PM2.5 Emission Inventory) (Shibata and Morikawa, 2021; https://www.env.go.jp/air/osen/pm/info.html)). These are compared with official estimates reported by the Greenhouse gas inventory office of Japan (GIO) to the UNFCCC (National Greenhouse Gas Inventory Report of Japan, 2020). For CO2, the inventories generally show good agreement, with differences between GIO's reported emissions and those from other inventories differing by ±10%. However, the consensus among different inventories for CH4 and NOx is not as strong as for CO2, with the greatest variation being a factor of two, although all inventories show generally decreasing trends. Specifically, CH4 emissions reported by EDGARv8.0, ECLIPSEv6b, and CEDSv2021-04-21 are 24–83% higher than the official estimates of GIO. In contrast, for NOx, emissions estimated by ECLIPSEv6b and JEI-DB_PM2.5EI are 28–40% lower than those reported by the other four inventories, which are relatively similar. It should also be noted that the magnitude of the observed decreasing trends varies by inventory. For CH4, annual decreases range from −0.5% to −1.7% per year, while for NOx, reductions range from −2.2% to −3.4% per year.
Satellite observations of atmospheric GHGs can significantly address the challenges in improving the accuracy of GHG emissions estimates and enhancing the transparency of emissions reduction efforts. Such improvements will enhance the transparency of emission reports published by countries that have ratified the Paris Agreement. The 2019 Refinement to the 2006 IPCC Guidelines for National Greenhouse Gas Inventories (Vol. 1, Chapter 6 “Quality Assurance/Quality Control and Verification”), recommends the use of satellite data as an input to inverse modeling, especially when in situ data are insufficient or not available. Satellite-derived XCO2 and XCH4 data are widely used for inversion processes, land ecosystem model flux verification, and understanding transport processes (Calle et al., 2019; Chandra et al., 2021; Kunchala et al., 2022; Patra et al., 2021). Recent studies using CH4 vertical profiles from GOSAT have uncovered a transport pathway for air masses from the northern to southern hemisphere via the South Asian monsoon system (Belikov et al., 2022).
In 2017, the inter-agency community coordinated by the Committee on Earth Observations Satellites (CEOS) initiated discussions on how the scientific community could effectively leverage the capabilities of advanced GHG satellite observations. These satellites offer much higher resolution and broader coverage of the globe, including regions that are too geographically or politically challenging for ground-based monitoring networks. The initial phase was successful in defining the essential characteristics of a global architecture for monitoring atmospheric CO2 and CH4 concentrations, as well as their natural and anthropogenic fluxes from space. This includes outlining the science requirements and integrating existing and planned measurement and modeling capabilities (Greenhouse Gas Whitepaper, 2018, https://ceos.org/publications-key-documents/). This initiative subsequently evolved to propose a roadmap for implementing a constellation architecture dedicated to monitoring CO2 and CH4 from space (Greenhouse Gas Roadmap, 2020).
The GOSAT-GW greenhouse gases observing mission will actively participate in this important initiative led by CEOS, particularly within the GHG Task Team, which aims to make contributions to the WMO’s Global Greenhouse Gas Watch (G3W) initiative. This collaboration includes satellites such as OCO-2 and OCO-3, along with CO2M, which is scheduled for launch in 2026. In addition, since NO2 is an important air pollutant, air quality policy is also a target of our mission, positioning GOSAT-GW observations as a valuable complement to those conducted by GEMS and TROPOMI. The Atmospheric Composition Virtual Constellation (AC-VC) of the Committee on Earth Observation Satellites (CEOS) provides an ideal platform for discussing how to achieve synergetic benefits from these satellite constellations. Importantly, GOSAT-GW will facilitate critical intercomparisons with CO2M, particularly in terms of algorithms and flux estimates, as both missions will observe CO2 and NO2. The spatial resolutions of the GOSAT-GW’s Focus Mode are comparable to those of CO2M. Additionally, the co-located observations from GOSAT-GW’s Focus Mode and OCO-3’s Snapshot Area Map (SAM) mode will benefit cross-comparison exercises. The diurnal cycles captured by GEMS observations, combined with the high-resolution mapping capabilities of GOSAT-GW, will provide additional insights into emissions as well as the chemistry and dynamics of NOx in urban areas across Asia. A further collaboration could involve cross-comparisons of the 1 km × 1 km NO2 data from GOSAT-GW with similarly scaled NO2 maps derived from oversampled TROPOMI data (https://lego-bel-aq.aeronomie.be/index.php).
It is also important to recognize CH4 not only as a climate active trace gas, but also as a potent precursor for tropospheric ozone. Satellite observation of CH4 presents unique challenges due to the diversity of its emission sources, both natural and anthropogenic. However, its spatiotemporal variability is larger than that of CO2, which somewhat simplifies the detection of CH4 emissions via satellite compared to CO2. Recent satellite observations have reported anomalously high CH4 emissions from oil/gas production areas such as the Permian Basin (Varon et al., 2019; Zhang et al., 2020; Irakulis-Loitxate et al., 2021) and coal mine vents (Varon et al., 2020). Furthermore, the new international initiative, International Methane Emissions Observatory (IMEO) (https://www.unep.org/explore-topics/energy/what-we-do/methane/about-imeo), launched by UNEP, represents another important platform where GOSAT-GW observations can contribute to global efforts in climate change mitigation (Jacob et al., 2022).